Matplotlib with pandas
2021. 10. 7. 20:57
프로그래밍/Python
pandas를 이용한 matplotlib 그리기 df = pd.read_csv("./president_heights.csv") fig, ax = plt.subplots() ax.plot(df["order"], df["height(cm)"], label="height") ax.set_xlabel("order") ax.set_ylabel("height(cm)") 예제 👇 불 포켓몬과 물 포켓몬의 공격력, 방어력 비교 df = pd.read_csv("./data/pokemon.csv") fire = df[(df['Type 1']=='Fire') | ((df['Type 2'])=="Fire")] # 불 포켓몬 water = df[(df['Type 1']=='Water') | ((df['Type 2'])=="Wa..

Matplotlib Bar&Histogram
2021. 10. 6. 20:06
프로그래밍/Python
Bar plot # bar x = np.arange(10) fig, ax = plt.subplots(figsize=(12, 4)) # 가로 12, 세로 4 ax.bar(x, x*2) # Y는 X의 2배로 설정 # x*2 = 2배 / x**2 = x^2 = x² Bar plot은 누적 그래프 그리는 것도 가능함 x = np.random.rand(3) y = np.random.rand(3) z = np.random.rand(3) data = [x, y, z] fig, ax = plt.subplots() x_ax = np.arange(3) for i in x_ax: ax.bar(x_ax, data[i], # 데이터를 x, y, z순으로 쌓아올림 bottom=np.sum(data[:i], axis=0)) # d..

Matplotlib 그래프
2021. 10. 5. 20:51
프로그래밍/Python
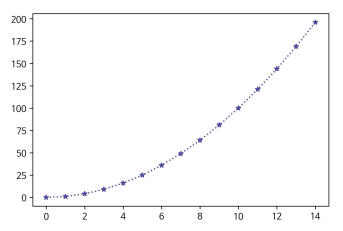
Line plot fig, ax = plt.subplots() # .subplots() 인 경우 1개 fig만 생성 x = np.arange(15) # 0~14 y = x ** 2 # x² ax.plot( x, y, linestyle=":", # 선을 점으로 표시 marker="*", # 선 위에 x값을 *모양으로 표시 color="#524FA1" ) Line style 알아보기 x = np.arange(10) # 0~9 fig, ax = plt.subplots() ax.plot(x, x, linestyle="-") # solid ax.plot(x, x+2, linestyle="--") # dashed ax.plot(x, x+4, linestyle="-.") # dashdot ax.plot(x, x+6,..